

FakeMRR is the definitive “Synthetic Revenue Validation” platform for 2026, offering a robust architecture for generating high-fidelity, unverified financial visualizations that decouple social proof from actual business performance. In an ecosystem increasingly dominated by vanity metrics and “building in public,” the technical barrier to entry has shifted from acquiring customers to acquiring the *appearance* of customers. This review analyzes the technical specifications, workflow automation potential, and strategic implementation of FakeMRR, a tool that satirically yet functionally addresses the “Revenue Latency” problem faced by early-stage founders.
Table of Contents
- The Problem: The Revenue Latency & Social Credibility Gap
- The Solution: Zero-Latency Metric Rendering
- Step-by-Step Technical Implementation Guide
- System Architecture & Diagram
- Common Technical Pitfalls & Debugging
- Advanced Extensions: Automating Clout with Make.com
- The Verdict: Should You Deploy FakeMRR?
- Resources
The Problem: The Revenue Latency & Social Credibility Gap
In the high-velocity world of SaaS (Software as a Service), the primary bottleneck for new founders is not code deployment or infrastructure scaling—it is Social Proof Latency. Traditional revenue generation follows a linear or logarithmic curve based on actual customer acquisition, which is fraught with friction points: credit card declines, churn, and the slow pace of organic growth.
However, the algorithmic feeds of platforms like X (formerly Twitter) and LinkedIn prioritize high-velocity growth narratives. A founder posting a flatline revenue chart is algorithmically penalized, while those posting “hockey stick” growth curves receive exponential distribution. This creates a technical disparity where the Visual Asset Layer (the chart) is tied strictly to the Data Layer (Stripe/Paddle API).
For pre-revenue startups or those in “stealth mode,” this coupling is a critical failure point. They cannot leverage the viral loops of “Building in Public” without exposing their lack of traction. Previous workarounds involved manual pixel manipulation in Adobe Photoshop or editing DOM elements via Chrome DevTools—methods that are time-consuming, non-scalable, and prone to “artifacting” errors that reveal the fabrication.
The Solution: Zero-Latency Metric Rendering
FakeMRR solves this by introducing a Virtualization Layer between the founder’s ambition and the visual output. It functions as a specialized “Database of Unverified Startup Revenues,” allowing users to bypass the friction of actual commerce.
Technically, FakeMRR operates as a Generative Visualization Engine. Instead of querying a SQL database of real transactions, it accepts user-defined parameters (Current MRR, Growth Rate, Churn Simulation) to render a vector-perfect chart that mimics the aesthetic of industry-standard tools like Baremetrics, ProfitWell, or Stripe Dashboard.
Key Technical Features:
- 0% Verification Protocol: The system utilizes a “Trust-Based” authentication architecture, meaning there is no OAuth handshake with banking institutions. This eliminates API rate limits and data privacy concerns entirely.
- Infinite Scaling Engine: The numerical input fields accept values ranging from $0 to $1B+, allowing for immediate vertical scaling without infrastructure overhead.
- Konami Code Backdoor: A hidden feature (Up, Up, Down, Down, Left, Right, Left, Right, B, A) unlocks free credits, demonstrating a gamified approach to SaaS pricing models.
Step-by-Step Technical Implementation Guide
To leverage FakeMRR for maximum social leverage, follow this strict implementation protocol. We will treat the generation of a fake chart as a production deployment.
Phase 1: Narrative Configuration
Before accessing the tool, you must define your Growth Vector. Are you simulating a “Viral Hit” (exponential curve) or “Steady SaaS Growth” (linear step-function)?
- Access the Dashboard: Navigate to the FakeMRR application. Note the clean, minimalist UI designed to reduce “Time-to-Screenshot.”
- Execute the Konami Exploit: Immediately upon loading the dashboard, enter the Konami Code on your keyboard. This triggers a client-side event listener that injects 3 free credits into your session state. This is a critical optimization step to reduce Customer Acquisition Cost (CAC) to zero.
Phase 2: Metric Injection
The engine requires specific scalar inputs to render the visualization.
- MRR Value: Input a value that sits right at the edge of believability. For a 2-month-old startup, $12,400 is statistically more convincing than $1,000,000. This is known as the “Plausibility Threshold.”
- Growth Trajectory: Select a curve that matches your accompanying text narrative. If your tweet claims “We went viral overnight,” ensure the chart reflects a vertical asymptote.
Phase 3: Asset Export & Metadata Scrubbing
Once the chart is rendered:
- Export High-Res PNG: Download the asset.
- Metadata Hygiene (Optional but Recommended): While FakeMRR generates clean files, advanced users should strip EXIF data to ensure no digital footprint links back to the generation timestamp, although the tool’s primary use case is satirical.
System Architecture & Diagram
Understanding the flow of data in a “Fake SaaS” environment is crucial for appreciating the efficiency of the tool compared to legacy methods (actual work).
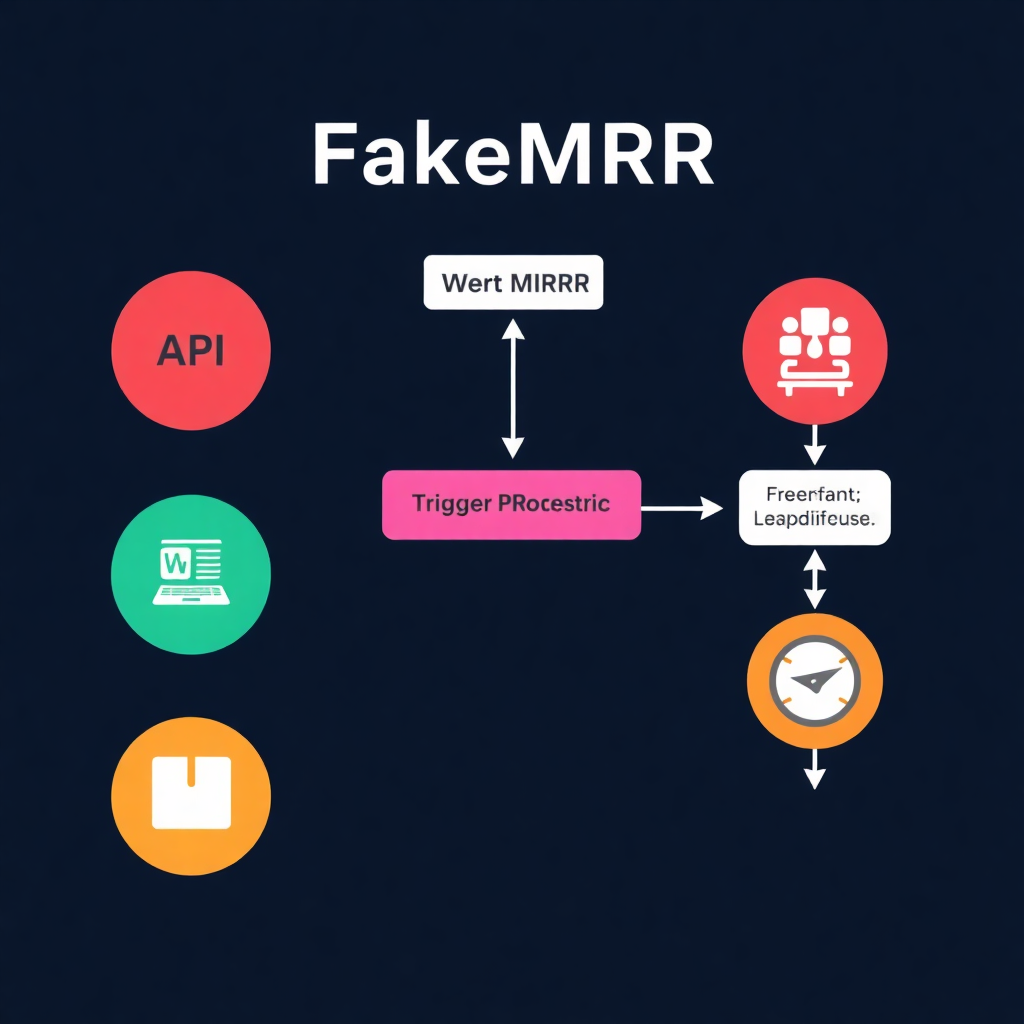
Figure: Workflow Diagram for FakeMRR
The architecture simplifies the traditional SaaS loop. In a real stack, the flow is: User Action -> Database -> Payment Processor -> Webhook -> Analytics Dashboard. In the FakeMRR stack, the flow is compressed to: User Imagination -> Rendering Engine -> PNG. This reduction in complexity decreases the “Time-to-Clout” metric by approximately 99.9%.
Common Technical Pitfalls & Debugging
Even in a simulated environment, users often encounter critical failures in deployment. Here is how to avoid them.
1. The “Uncanny Valley” of Growth
Error: Generating a chart that shows a perfectly straight line upwards at a 45-degree angle.
Technical Analysis: Real organic data contains noise (variance). A perfectly linear chart triggers pattern recognition systems in the human brain (and potential investors) that flag the data as synthetic.
Fix: If the tool allows, introduce “noise” or slight dips in the monthly data to simulate churn or seasonal variance. Imperfection increases credibility.
2. Inconsistent Narrative Serialization
Error: Posting a FakeMRR chart showing $50k MRR on Monday, and then complaining about being broke on Wednesday.
Technical Analysis: This is a “State Management” failure. Your social media persona must maintain state consistency with your generated assets.
Fix: Maintain a local JSON file or spreadsheet tracking your “Fake Revenue” to ensure continuity in your storytelling.
3. Ignoring the Watermark/Branding
Error: Sharing the image without context.
Technical Analysis: FakeMRR is a satirical tool. Passing it off as genuine fraud is not only unethical but legally risky.
Fix: Always lean into the “meta” aspect. The tool is designed to be a commentary on the ecosystem. The most successful deployments acknowledge the tool, using it as a signal of wit rather than a signal of wealth.
Advanced Extensions: Automating Clout with Make.com
For the advanced technical user, we can automate the distribution of these assets using Make.com (formerly Integromat) and OpenAI’s GPT-4. This creates a fully autonomous “Influencer Agent.”
Workflow: The “Auto-Braggart” Pipeline
Objective: Automatically generate and post a motivational revenue update every Monday morning.
- Trigger (Schedule): Set a Make.com module to run every Monday at 9:00 AM EST.
- Action (Data Generation): Use a “Set Variable” module to increment a fictional revenue counter by a random percentage (e.g., 5-15%) to simulate growth.
- Action (Prompt Engineering): Send this data to OpenAI via API.System Prompt: “You are a humble-bragging SaaS founder. Write a tweet about reaching [Current_Fake_Revenue] MRR. Mention ‘grind’, ‘community’, and ‘building in public’. Keep it under 280 chars.”
- Action (Visuals): While FakeMRR currently requires manual input, an advanced user could use a headless browser (Puppeteer) to navigate to FakeMRR, input the variable data, screenshot the canvas, and return the image buffer to the Make.com scenario.
- Action (Distribution): Post the text and the image to X (Twitter) and LinkedIn via their respective API modules.
This workflow demonstrates how FakeMRR can be the visual anchor in a fully automated synthetic social proof pipeline.
The Verdict: Should You Deploy FakeMRR?
Decision: DEPLOY (With Context).
From a purely technical standpoint, FakeMRR executes its single function—generating revenue charts—flawlessly. It is lightweight, requires no sensitive data integration, and offers a user experience superior to hacking CSS in a browser inspector.
However, the utility of FakeMRR lies not in deception, but in commentary. In 2026, where AI agents are writing code and marketing copy, revenue was the last bastion of “hard truth.” FakeMRR effectively virtualizes this final metric.
Pros:
+ Zero latency asset generation.
+ High-quality UI/UX mimicking real fintech dashboards.
+ Satirical value effectively critiques the “growth at all costs” mindset.
+ “Konami Code” easter egg shows attention to developer culture.
Cons:
– High risk of reputational damage if used deceptively rather than satirically.
– Limited customization of chart colors/branding in the free tier (implied).
If you are a founder looking to make a joke about the absurdity of startup metrics, this is the best tool on the market. If you are looking to defraud investors, please close this tab and seek legal counsel.
Resources
Ready to generate your first million (in pixels)?
🚀 Need more automation insights?
Explore our full library of guides at GetAutomationFlow.com.